
 - Blog
| Conference: | OVC |
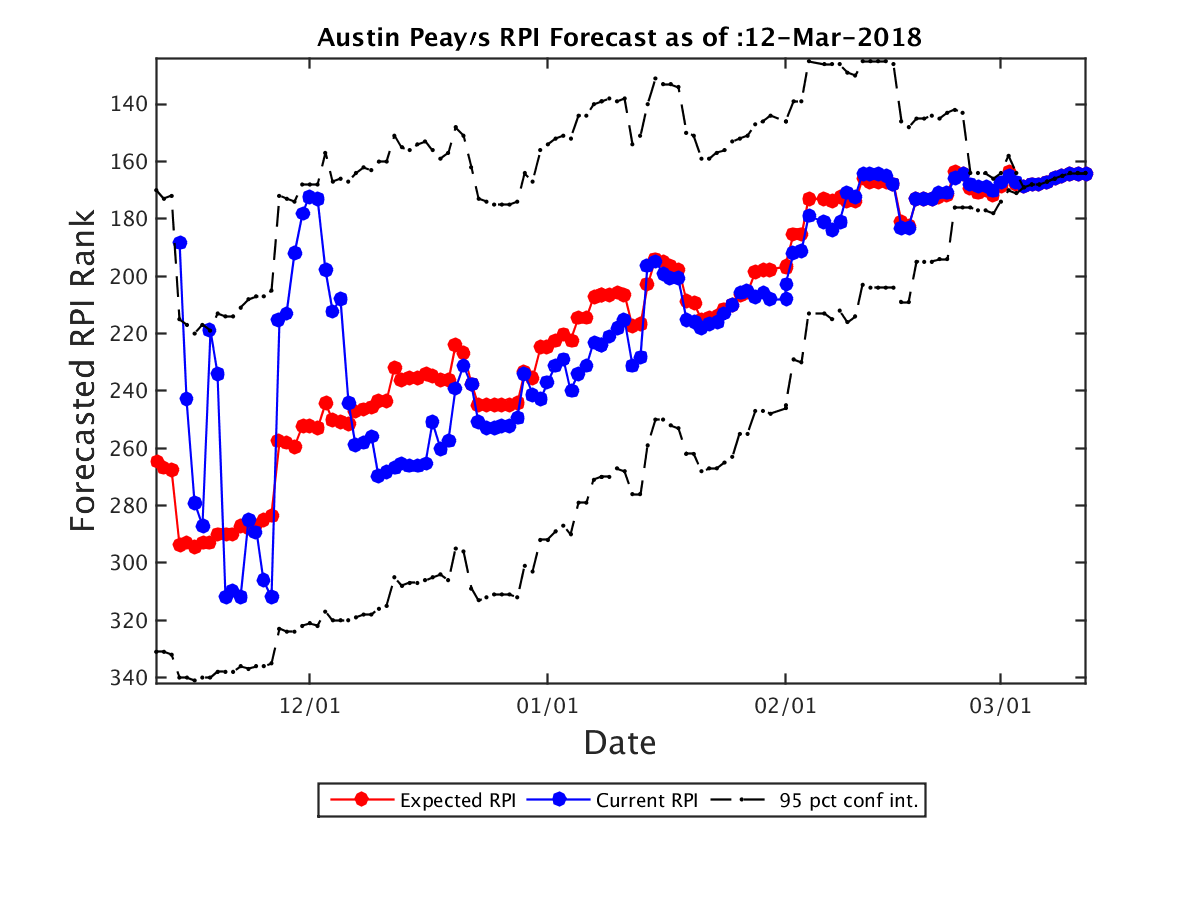
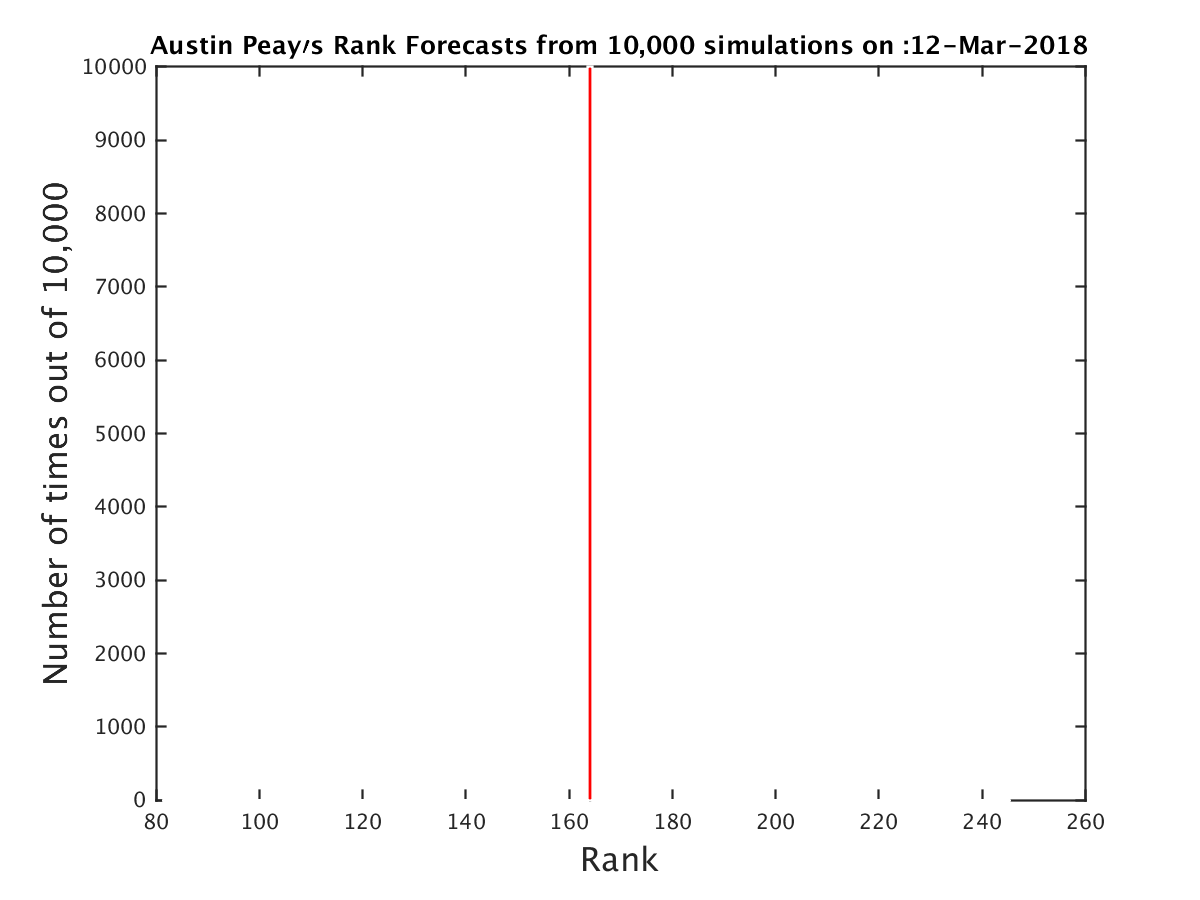
| Expected RPI: | 164.0 |
| Current RPI: | 164 |
| Expected SOS: | 180 |
| Current SOS: | 180 |
| Current Record: | 16-14 |
| Expected Record: | 16-14 |
| Current Conf Record: | 13-7 |
| Expected Conf Record: | 13-7 |
| Expected Record vs RPI 1-25: | 0-1 |
| Expected Record vs RPI 26-50: | 0-3 |
| Expected Record vs RPI 51-100: | 0-3 |
| Expected Record vs RPI 101-200: | 4-7 |
| Expected Record vs RPI 200+: | 12-0 |
| Current OOC Record: | 3-7 |
| Expected OOC Record: | 3-7 |
| Expected OOC RPI: | 260 |
| Expected OOC SOS: | 128 |
| Final Record | Expected RPI | Probability |
|---|---|---|
| 16-14 | 164.0 | 100.00% |
| Date | Opponent (Expected RPI) | Conf | Location | Score | Outcome | Prob(W) | Spread |
|---|---|---|---|---|---|---|---|
| 11-10 | Vanderbilt (132.0) | SEC | A | 73-54 | L | 0% | 0.0 |
| 11-13 | Virginia (1.0) | ACC | A | 93-49 | L | 0% | 0.0 |
| 11-19 | UNC Asheville (130.0) | BSth | H | 79-82 | L | 0% | 0.0 |
| 11-26 | Miami OH (159.0) | MAC | H | 86-61 | W | 100% | 0.0 |
| 11-29 | Oklahoma St. (88.0) | B12 | A | 79-63 | L | 0% | 0.0 |
| 12-2 | Alabama A&M (350.0) | SWAC | H | 67-47 | W | 100% | 0.0 |
| 12-6 | Illinois (181.0) | B10 | A | 64-57 | L | 0% | 0.0 |
| 12-16 | Evansville (151.0) | MVC | A | 78-74 | L | 0% | 0.0 |
| 12-19 | Troy (194.0) | SB | H | 75-73 | W | 100% | 0.0 |
| 12-22 | Western Kentucky (39.0) | CUSA | H | 55-72 | L | 0% | 0.0 |
| 12-28 | SIU Edwardsville (287.0) | OVC | H | 78-58 | W | 100% | 0.0 |
| 12-30 | Eastern Illinois (262.0) | OVC | H | 70-54 | W | 100% | 0.0 |
| 1-4 | Tennessee Martin (306.0) | OVC | H | 75-69 | W | 100% | 0.0 |
| 1-6 | Southeast Missouri St. (257.0) | OVC | H | 76-71 | W | 100% | 0.0 |
| 1-11 | Tennessee Tech (158.0) | OVC | A | 86-74 | L | 0% | 0.0 |
| 1-13 | Jacksonville St. (149.0) | OVC | A | 67-87 | W | 100% | 0.0 |
| 1-18 | Tennessee St. (189.0) | OVC | A | 70-56 | L | 0% | 0.0 |
| 1-20 | Belmont (81.0) | OVC | A | 83-59 | L | 0% | 0.0 |
| 1-25 | Eastern Kentucky (271.0) | OVC | H | 90-84 | W | 100% | 0.0 |
| 1-27 | Morehead St. (292.0) | OVC | H | 92-76 | W | 100% | 0.0 |
| 2-1 | Tennessee Martin (306.0) | OVC | A | 57-59 | W | 100% | 0.0 |
| 2-3 | Southeast Missouri St. (257.0) | OVC | A | 81-96 | W | 100% | 0.0 |
| 2-8 | Murray St. (48.0) | OVC | A | 84-63 | L | 0% | 0.0 |
| 2-10 | Eastern Illinois (262.0) | OVC | A | 69-76 | W | 100% | 0.0 |
| 2-15 | Tennessee Tech (158.0) | OVC | H | 80-86 | L | 0% | 0.0 |
| 2-17 | Jacksonville St. (149.0) | OVC | H | 60-57 | W | 100% | 0.0 |
| 2-22 | SIU Edwardsville (287.0) | OVC | A | 82-86 | W | 100% | 0.0 |
| 2-24 | Murray St. (48.0) | OVC | H | 64-73 | L | 0% | 0.0 |
| 3-1 | Eastern Illinois (262.0) | OVC | N | 73-66 | W | 100% | 0.0 |
| 3-2 | Belmont (81.0) | OVC | N | 79-94 | L | 0% | 0.0 |
| Team | Conf | Curr Wgt | Fut Wgt | Curr W/L | Exp W/L | Curr Impact | Exp Impact |
|---|---|---|---|---|---|---|---|
| Austin Peay | OVC | 26.38 | 26.38 | 53.85 | 53.85 | 2.03 | 2.03 |
| Eastern Illinois | OVC | 5.81 | 5.81 | 38.46 | 38.46 | -1.34 | -1.34 |
| Murray St. | OVC | 4.30 | 4.30 | 81.48 | 81.48 | 2.71 | 2.71 |
| Belmont | OVC | 4.29 | 4.29 | 70.97 | 70.97 | 1.80 | 1.80 |
| SIU Edwardsville | OVC | 4.23 | 4.23 | 32.14 | 32.14 | -1.51 | -1.51 |
| Jacksonville St. | OVC | 4.20 | 4.20 | 66.67 | 66.67 | 1.40 | 1.40 |
| Tennessee Tech | OVC | 4.20 | 4.20 | 51.72 | 51.72 | 0.14 | 0.14 |
| Southeast Missouri St. | OVC | 4.18 | 4.18 | 44.44 | 44.44 | -0.46 | -0.46 |
| Tennessee Martin | OVC | 4.18 | 4.18 | 29.63 | 29.63 | -1.70 | -1.70 |
| Tennessee St. | OVC | 2.64 | 2.64 | 44.44 | 44.44 | -0.29 | -0.29 |
| Eastern Kentucky | OVC | 2.55 | 2.55 | 32.14 | 32.14 | -0.91 | -0.91 |
| Morehead St. | OVC | 2.53 | 2.53 | 23.08 | 23.08 | -1.36 | -1.36 |
| Vanderbilt | SEC | 1.77 | 1.77 | 35.48 | 35.48 | -0.51 | -0.51 |
| Western Kentucky | CUSA | 1.75 | 1.75 | 68.75 | 68.75 | 0.65 | 0.65 |
| Evansville | MVC | 1.72 | 1.72 | 48.28 | 48.28 | -0.06 | -0.06 |
| Illinois | B10 | 1.72 | 1.72 | 40.00 | 40.00 | -0.34 | -0.34 |
| UNC Asheville | BSth | 1.69 | 1.69 | 60.00 | 60.00 | 0.34 | 0.34 |
| Virginia | ACC | 1.69 | 1.69 | 93.75 | 93.75 | 1.48 | 1.48 |
| Alabama A&M | SWAC | 1.67 | 1.67 | 10.00 | 10.00 | -1.33 | -1.33 |
| Miami OH | MAC | 1.67 | 1.67 | 46.67 | 46.67 | -0.11 | -0.11 |
| Oklahoma St. | B12 | 1.67 | 1.67 | 56.25 | 56.25 | 0.21 | 0.21 |
| Troy | SB | 1.67 | 1.67 | 46.67 | 46.67 | -0.11 | -0.11 |
| Western Illinois | Sum | 0.25 | 0.25 | 33.33 | 33.33 | -0.08 | -0.08 |
| North Carolina Central | MEAC | 0.23 | 0.23 | 51.61 | 51.61 | 0.01 | 0.01 |
| Southern Illinois | MVC | 0.23 | 0.23 | 59.38 | 59.38 | 0.04 | 0.04 |
| South Alabama | SB | 0.22 | 0.22 | 40.00 | 40.00 | -0.04 | -0.04 |
| Marshall | CUSA | 0.22 | 0.22 | 69.70 | 69.70 | 0.09 | 0.09 |
| Chattanooga | SC | 0.22 | 0.22 | 25.81 | 25.81 | -0.10 | -0.10 |
| Lipscomb | ASun | 0.22 | 0.22 | 68.97 | 68.97 | 0.08 | 0.08 |
| Middle Tennessee | CUSA | 0.21 | 0.21 | 76.67 | 76.67 | 0.11 | 0.11 |
| Bradley | MVC | 0.20 | 0.20 | 59.38 | 59.38 | 0.04 | 0.04 |
| TCU | B12 | 0.18 | 0.18 | 65.62 | 65.62 | 0.06 | 0.06 |
| IUPUI | Horz | 0.17 | 0.17 | 32.14 | 32.14 | -0.06 | -0.06 |
| Mississippi St. | SEC | 0.16 | 0.16 | 65.62 | 65.62 | 0.05 | 0.05 |
| Nebraska | B10 | 0.14 | 0.14 | 68.75 | 68.75 | 0.05 | 0.05 |
| Arkansas Pine Bluff | SWAC | 0.14 | 0.14 | 40.00 | 40.00 | -0.03 | -0.03 |
| Southern | SWAC | 0.14 | 0.14 | 41.94 | 41.94 | -0.02 | -0.02 |
| Purdue | B10 | 0.14 | 0.14 | 82.35 | 82.35 | 0.09 | 0.09 |
| Green Bay | Horz | 0.14 | 0.14 | 33.33 | 33.33 | -0.05 | -0.05 |
| Central Michigan | MAC | 0.14 | 0.14 | 53.33 | 53.33 | 0.01 | 0.01 |
| Alabama St. | SWAC | 0.14 | 0.14 | 25.81 | 25.81 | -0.07 | -0.07 |
| Kansas St. | B12 | 0.13 | 0.13 | 66.67 | 66.67 | 0.04 | 0.04 |
| Ohio | MAC | 0.13 | 0.13 | 43.33 | 43.33 | -0.02 | -0.02 |
| UAB | CUSA | 0.13 | 0.13 | 58.06 | 58.06 | 0.02 | 0.02 |
| Saint Louis | A10 | 0.11 | 0.11 | 50.00 | 50.00 | 0.00 | 0.00 |
| UMKC | WAC | 0.11 | 0.11 | 27.59 | 27.59 | -0.05 | -0.05 |
| Illinois St. | MVC | 0.11 | 0.11 | 53.12 | 53.12 | 0.01 | 0.01 |
| Arkansas St. | SB | 0.11 | 0.11 | 30.00 | 30.00 | -0.04 | -0.04 |
| Akron | MAC | 0.11 | 0.11 | 41.94 | 41.94 | -0.02 | -0.02 |
| Valparaiso | MVC | 0.11 | 0.11 | 43.33 | 43.33 | -0.01 | -0.01 |
| Louisiana Tech | CUSA | 0.11 | 0.11 | 48.39 | 48.39 | -0.00 | -0.00 |
| Wright St. | Horz | 0.11 | 0.11 | 71.88 | 71.88 | 0.05 | 0.05 |
| LSU | SEC | 0.11 | 0.11 | 54.84 | 54.84 | 0.01 | 0.01 |
| Charleston Southern | BSth | 0.11 | 0.11 | 42.86 | 42.86 | -0.02 | -0.02 |
| Georgia St. | SB | 0.11 | 0.11 | 68.75 | 68.75 | 0.04 | 0.04 |
| Indiana | B10 | 0.11 | 0.11 | 51.61 | 51.61 | 0.00 | 0.00 |
| Buffalo | MAC | 0.11 | 0.11 | 75.76 | 75.76 | 0.05 | 0.05 |
| Louisiana Monroe | SB | 0.11 | 0.11 | 46.43 | 46.43 | -0.01 | -0.01 |
| Kansas | B12 | 0.11 | 0.11 | 79.41 | 79.41 | 0.06 | 0.06 |
| Wisconsin | B10 | 0.10 | 0.10 | 45.45 | 45.45 | -0.01 | -0.01 |
| Houston Baptist | Slnd | 0.10 | 0.10 | 10.71 | 10.71 | -0.08 | -0.08 |
| Marquette | BE | 0.09 | 0.09 | 59.38 | 59.38 | 0.02 | 0.02 |
| San Diego St. | MWC | 0.09 | 0.09 | 67.74 | 67.74 | 0.03 | 0.03 |
| Kennesaw St. | ASun | 0.08 | 0.08 | 28.57 | 28.57 | -0.04 | -0.04 |
| Auburn | SEC | 0.08 | 0.08 | 78.12 | 78.12 | 0.05 | 0.05 |
| Northern Iowa | MVC | 0.08 | 0.08 | 46.67 | 46.67 | -0.01 | -0.01 |
| Prairie View A&M | SWAC | 0.08 | 0.08 | 45.45 | 45.45 | -0.01 | -0.01 |
| Fort Wayne | Sum | 0.08 | 0.08 | 50.00 | 50.00 | 0.00 | 0.00 |
| Bowling Green | MAC | 0.08 | 0.08 | 46.67 | 46.67 | -0.01 | -0.01 |
| New Mexico | MWC | 0.08 | 0.08 | 54.55 | 54.55 | 0.01 | 0.01 |
| Virginia Tech | ACC | 0.08 | 0.08 | 65.62 | 65.62 | 0.03 | 0.03 |
| Oregon St. | P12 | 0.08 | 0.08 | 50.00 | 50.00 | 0.00 | 0.00 |
| Indiana St. | MVC | 0.08 | 0.08 | 37.93 | 37.93 | -0.02 | -0.02 |
| Missouri St. | MVC | 0.08 | 0.08 | 53.12 | 53.12 | 0.01 | 0.01 |
| DePaul | BE | 0.08 | 0.08 | 35.48 | 35.48 | -0.02 | -0.02 |
| Furman | SC | 0.08 | 0.08 | 67.74 | 67.74 | 0.03 | 0.03 |
| Liberty | BSth | 0.08 | 0.08 | 54.84 | 54.84 | 0.01 | 0.01 |
| Longwood | BSth | 0.08 | 0.08 | 13.33 | 13.33 | -0.06 | -0.06 |
| Texas | B12 | 0.08 | 0.08 | 57.58 | 57.58 | 0.01 | 0.01 |
| Alcorn St. | SWAC | 0.08 | 0.08 | 25.00 | 25.00 | -0.04 | -0.04 |
| Missouri | SEC | 0.08 | 0.08 | 61.29 | 61.29 | 0.02 | 0.02 |
| Radford | BSth | 0.08 | 0.08 | 62.50 | 62.50 | 0.02 | 0.02 |
| Mississippi Valley St. | SWAC | 0.08 | 0.08 | 12.50 | 12.50 | -0.06 | -0.06 |
| Southern Miss | CUSA | 0.08 | 0.08 | 40.00 | 40.00 | -0.02 | -0.02 |
| Kentucky | SEC | 0.08 | 0.08 | 70.59 | 70.59 | 0.03 | 0.03 |
| Samford | SC | 0.08 | 0.08 | 26.67 | 26.67 | -0.04 | -0.04 |
| USC Upstate | ASun | 0.08 | 0.08 | 10.71 | 10.71 | -0.06 | -0.06 |
| Arkansas | SEC | 0.08 | 0.08 | 67.65 | 67.65 | 0.03 | 0.03 |
| Clemson | ACC | 0.08 | 0.08 | 71.88 | 71.88 | 0.03 | 0.03 |
| Savannah St. | MEAC | 0.08 | 0.08 | 43.33 | 43.33 | -0.01 | -0.01 |
| Charlotte | CUSA | 0.08 | 0.08 | 17.86 | 17.86 | -0.05 | -0.05 |
| Louisville | ACC | 0.08 | 0.08 | 60.61 | 60.61 | 0.02 | 0.02 |
| Oklahoma | B12 | 0.08 | 0.08 | 58.06 | 58.06 | 0.01 | 0.01 |
| Old Dominion | CUSA | 0.08 | 0.08 | 78.12 | 78.12 | 0.04 | 0.04 |
| Pepperdine | WCC | 0.08 | 0.08 | 16.13 | 16.13 | -0.05 | -0.05 |
| West Virginia | B12 | 0.08 | 0.08 | 70.59 | 70.59 | 0.03 | 0.03 |
| Central Arkansas | Slnd | 0.06 | 0.06 | 50.00 | 50.00 | 0.00 | 0.00 |
| Northern Kentucky | Horz | 0.06 | 0.06 | 68.97 | 68.97 | 0.02 | 0.02 |
| Canisius | MAAC | 0.06 | 0.06 | 65.62 | 65.62 | 0.02 | 0.02 |
| Cal St. Northridge | BW | 0.06 | 0.06 | 14.29 | 14.29 | -0.04 | -0.04 |
| Detroit | Horz | 0.06 | 0.06 | 20.00 | 20.00 | -0.03 | -0.03 |
| Florida A&M | MEAC | 0.06 | 0.06 | 24.24 | 24.24 | -0.03 | -0.03 |
| Marist | MAAC | 0.06 | 0.06 | 19.35 | 19.35 | -0.04 | -0.04 |
| Montana St. | BSky | 0.06 | 0.06 | 36.67 | 36.67 | -0.02 | -0.02 |
| Chicago St. | WAC | 0.06 | 0.06 | 3.33 | 3.33 | -0.05 | -0.05 |
| Creighton | BE | 0.06 | 0.06 | 64.52 | 64.52 | 0.02 | 0.02 |
| Drake | MVC | 0.06 | 0.06 | 48.39 | 48.39 | -0.00 | -0.00 |
| Loyola Chicago | MVC | 0.06 | 0.06 | 84.38 | 84.38 | 0.04 | 0.04 |
| Stetson | ASun | 0.06 | 0.06 | 28.57 | 28.57 | -0.02 | -0.02 |
| Mississippi | SEC | 0.05 | 0.05 | 37.50 | 37.50 | -0.01 | -0.01 |
| Rice | CUSA | 0.05 | 0.05 | 17.24 | 17.24 | -0.04 | -0.04 |
| Appalachian St. | SB | 0.05 | 0.05 | 41.94 | 41.94 | -0.01 | -0.01 |
| Campbell | BSth | 0.05 | 0.05 | 46.43 | 46.43 | -0.00 | -0.00 |
| Coastal Carolina | SB | 0.05 | 0.05 | 37.93 | 37.93 | -0.01 | -0.01 |
| Dayton | A10 | 0.05 | 0.05 | 45.16 | 45.16 | -0.01 | -0.01 |
| Eastern Michigan | MAC | 0.05 | 0.05 | 58.62 | 58.62 | 0.01 | 0.01 |
| Gardner Webb | BSth | 0.05 | 0.05 | 37.93 | 37.93 | -0.01 | -0.01 |
| Georgia Southern | SB | 0.05 | 0.05 | 61.29 | 61.29 | 0.01 | 0.01 |
| Grambling St. | SWAC | 0.05 | 0.05 | 53.33 | 53.33 | 0.00 | 0.00 |
| High Point | BSth | 0.05 | 0.05 | 40.74 | 40.74 | -0.01 | -0.01 |
| Iowa | B10 | 0.05 | 0.05 | 42.42 | 42.42 | -0.01 | -0.01 |
| Jackson St. | SWAC | 0.05 | 0.05 | 33.33 | 33.33 | -0.02 | -0.02 |
| Kent St. | MAC | 0.05 | 0.05 | 48.48 | 48.48 | -0.00 | -0.00 |
| Louisiana Lafayette | SB | 0.05 | 0.05 | 80.65 | 80.65 | 0.03 | 0.03 |
| Maryland Eastern Shore | MEAC | 0.05 | 0.05 | 16.67 | 16.67 | -0.04 | -0.04 |
| Michigan | B10 | 0.05 | 0.05 | 79.41 | 79.41 | 0.03 | 0.03 |
| Michigan St. | B10 | 0.05 | 0.05 | 87.88 | 87.88 | 0.04 | 0.04 |
| Minnesota | B10 | 0.05 | 0.05 | 46.88 | 46.88 | -0.00 | -0.00 |
| Nebraska Omaha | Sum | 0.05 | 0.05 | 24.14 | 24.14 | -0.03 | -0.03 |
| Ohio St. | B10 | 0.05 | 0.05 | 75.00 | 75.00 | 0.03 | 0.03 |
| Presbyterian | BSth | 0.05 | 0.05 | 27.59 | 27.59 | -0.02 | -0.02 |
| Rutgers | B10 | 0.05 | 0.05 | 42.42 | 42.42 | -0.01 | -0.01 |
| Texas Southern | SWAC | 0.05 | 0.05 | 44.12 | 44.12 | -0.01 | -0.01 |
| Toledo | MAC | 0.05 | 0.05 | 66.67 | 66.67 | 0.02 | 0.02 |
| Western Carolina | SC | 0.05 | 0.05 | 36.67 | 36.67 | -0.01 | -0.01 |
| Western Michigan | MAC | 0.05 | 0.05 | 50.00 | 50.00 | 0.00 | 0.00 |
| Winthrop | BSth | 0.05 | 0.05 | 57.14 | 57.14 | 0.01 | 0.01 |
| Duke | ACC | 0.05 | 0.05 | 78.79 | 78.79 | 0.03 | 0.03 |
| Alabama | SEC | 0.05 | 0.05 | 55.88 | 55.88 | 0.01 | 0.01 |
| Monmouth | MAAC | 0.05 | 0.05 | 35.48 | 35.48 | -0.02 | -0.02 |
| Rhode Island | A10 | 0.05 | 0.05 | 78.12 | 78.12 | 0.03 | 0.03 |
| UNC Greensboro | SC | 0.05 | 0.05 | 77.42 | 77.42 | 0.03 | 0.03 |
| Wake Forest | ACC | 0.05 | 0.05 | 35.48 | 35.48 | -0.02 | -0.02 |
| Florida | SEC | 0.05 | 0.05 | 62.50 | 62.50 | 0.01 | 0.01 |
| Georgia | SEC | 0.05 | 0.05 | 54.55 | 54.55 | 0.00 | 0.00 |
| Howard | MEAC | 0.05 | 0.05 | 25.81 | 25.81 | -0.03 | -0.03 |
| Richmond | A10 | 0.05 | 0.05 | 37.50 | 37.50 | -0.01 | -0.01 |
| Tennessee | SEC | 0.05 | 0.05 | 75.76 | 75.76 | 0.03 | 0.03 |
| Texas A&M | SEC | 0.05 | 0.05 | 62.50 | 62.50 | 0.01 | 0.01 |
| Baylor | B12 | 0.05 | 0.05 | 54.84 | 54.84 | 0.00 | 0.00 |
| Florida St. | ACC | 0.05 | 0.05 | 64.52 | 64.52 | 0.01 | 0.01 |
| Georgia Tech | ACC | 0.05 | 0.05 | 40.62 | 40.62 | -0.01 | -0.01 |
| Iowa St. | B12 | 0.05 | 0.05 | 41.94 | 41.94 | -0.01 | -0.01 |
| Milwaukee | Horz | 0.05 | 0.05 | 48.39 | 48.39 | -0.00 | -0.00 |
| North Carolina | ACC | 0.05 | 0.05 | 71.43 | 71.43 | 0.02 | 0.02 |
| Pittsburgh | ACC | 0.05 | 0.05 | 25.00 | 25.00 | -0.03 | -0.03 |
| Providence | BE | 0.05 | 0.05 | 61.76 | 61.76 | 0.01 | 0.01 |
| Seattle | WAC | 0.05 | 0.05 | 56.67 | 56.67 | 0.01 | 0.01 |
| Syracuse | ACC | 0.05 | 0.05 | 60.61 | 60.61 | 0.01 | 0.01 |
| Texas Tech | B12 | 0.05 | 0.05 | 72.73 | 72.73 | 0.02 | 0.02 |
| Washington | P12 | 0.05 | 0.05 | 62.50 | 62.50 | 0.01 | 0.01 |
| Butler | BE | 0.03 | 0.03 | 60.61 | 60.61 | 0.01 | 0.01 |
| Xavier | BE | 0.03 | 0.03 | 84.85 | 84.85 | 0.02 | 0.02 |
| North Carolina A&T | MEAC | 0.03 | 0.03 | 56.25 | 56.25 | 0.00 | 0.00 |
| Eastern Washington | BSky | 0.03 | 0.03 | 56.25 | 56.25 | 0.00 | 0.00 |
| Jacksonville | ASun | 0.03 | 0.03 | 37.93 | 37.93 | -0.01 | -0.01 |
| Norfolk St. | MEAC | 0.03 | 0.03 | 43.33 | 43.33 | -0.00 | -0.00 |
| Binghamton | AE | 0.03 | 0.03 | 31.03 | 31.03 | -0.01 | -0.01 |
| Fresno St. | MWC | 0.03 | 0.03 | 63.33 | 63.33 | 0.01 | 0.01 |
| Ball St. | MAC | 0.03 | 0.03 | 58.06 | 58.06 | 0.00 | 0.00 |
| Delaware St. | MEAC | 0.03 | 0.03 | 6.67 | 6.67 | -0.02 | -0.02 |
| East Tennessee St. | SC | 0.03 | 0.03 | 71.88 | 71.88 | 0.01 | 0.01 |
| Fordham | A10 | 0.03 | 0.03 | 29.03 | 29.03 | -0.01 | -0.01 |
| Georgetown | BE | 0.03 | 0.03 | 50.00 | 50.00 | 0.00 | 0.00 |
| Grand Canyon | WAC | 0.03 | 0.03 | 65.62 | 65.62 | 0.01 | 0.01 |
| Hartford | AE | 0.03 | 0.03 | 58.06 | 58.06 | 0.00 | 0.00 |
| Hawaii | BW | 0.03 | 0.03 | 53.57 | 53.57 | 0.00 | 0.00 |
| Illinois Chicago | Horz | 0.03 | 0.03 | 50.00 | 50.00 | 0.00 | 0.00 |
| Little Rock | SB | 0.03 | 0.03 | 20.00 | 20.00 | -0.02 | -0.02 |
| LIU Brooklyn | NEC | 0.03 | 0.03 | 51.52 | 51.52 | 0.00 | 0.00 |
| Maryland | B10 | 0.03 | 0.03 | 58.06 | 58.06 | 0.00 | 0.00 |
| New Mexico St. | WAC | 0.03 | 0.03 | 83.33 | 83.33 | 0.02 | 0.02 |
| Niagara | MAAC | 0.03 | 0.03 | 59.38 | 59.38 | 0.01 | 0.01 |
| North Dakota | BSky | 0.03 | 0.03 | 33.33 | 33.33 | -0.01 | -0.01 |
| Northern Illinois | MAC | 0.03 | 0.03 | 36.67 | 36.67 | -0.01 | -0.01 |
| Northwestern | B10 | 0.03 | 0.03 | 45.16 | 45.16 | -0.00 | -0.00 |
| Penn St. | B10 | 0.03 | 0.03 | 61.76 | 61.76 | 0.01 | 0.01 |
| Saint Mary's | WCC | 0.03 | 0.03 | 84.85 | 84.85 | 0.02 | 0.02 |
| Texas St. | SB | 0.03 | 0.03 | 41.94 | 41.94 | -0.00 | -0.00 |
| Tulane | Amer | 0.03 | 0.03 | 45.16 | 45.16 | -0.00 | -0.00 |
| UNLV | MWC | 0.03 | 0.03 | 60.61 | 60.61 | 0.01 | 0.01 |
| UT Arlington | SB | 0.03 | 0.03 | 60.61 | 60.61 | 0.01 | 0.01 |
| Wofford | SC | 0.03 | 0.03 | 60.00 | 60.00 | 0.01 | 0.01 |
| Arizona St. | P12 | 0.03 | 0.03 | 64.52 | 64.52 | 0.01 | 0.01 |
| Seton Hall | BE | 0.03 | 0.03 | 65.62 | 65.62 | 0.01 | 0.01 |
| South Carolina | SEC | 0.03 | 0.03 | 50.00 | 50.00 | 0.00 | 0.00 |
| USC | P12 | 0.03 | 0.03 | 67.65 | 67.65 | 0.01 | 0.01 |
| Boston College | ACC | 0.03 | 0.03 | 55.88 | 55.88 | 0.00 | 0.00 |
| Davidson | A10 | 0.03 | 0.03 | 65.62 | 65.62 | 0.01 | 0.01 |
| FIU | CUSA | 0.03 | 0.03 | 37.93 | 37.93 | -0.01 | -0.01 |
| Florida Atlantic | CUSA | 0.03 | 0.03 | 32.14 | 32.14 | -0.01 | -0.01 |
| Hampton | MEAC | 0.03 | 0.03 | 51.61 | 51.61 | 0.00 | 0.00 |
| Lehigh | Pat | 0.03 | 0.03 | 51.72 | 51.72 | 0.00 | 0.00 |
| Miami FL | ACC | 0.03 | 0.03 | 70.97 | 70.97 | 0.01 | 0.01 |
| Nicholls St. | Slnd | 0.03 | 0.03 | 60.71 | 60.71 | 0.01 | 0.01 |
| North Carolina St. | ACC | 0.03 | 0.03 | 65.62 | 65.62 | 0.01 | 0.01 |
| North Texas | CUSA | 0.03 | 0.03 | 43.33 | 43.33 | -0.00 | -0.00 |
| Notre Dame | ACC | 0.03 | 0.03 | 57.58 | 57.58 | 0.00 | 0.00 |
| Oral Roberts | Sum | 0.03 | 0.03 | 28.57 | 28.57 | -0.01 | -0.01 |
| SMU | Amer | 0.03 | 0.03 | 51.52 | 51.52 | 0.00 | 0.00 |
| Tulsa | Amer | 0.03 | 0.03 | 61.29 | 61.29 | 0.01 | 0.01 |
| UT Rio Grande Valley | WAC | 0.03 | 0.03 | 43.33 | 43.33 | -0.00 | -0.00 |
| UTEP | CUSA | 0.03 | 0.03 | 33.33 | 33.33 | -0.01 | -0.01 |
| UTSA | CUSA | 0.03 | 0.03 | 53.33 | 53.33 | 0.00 | 0.00 |
| VCU | A10 | 0.03 | 0.03 | 54.55 | 54.55 | 0.00 | 0.00 |
| Villanova | BE | 0.03 | 0.03 | 88.24 | 88.24 | 0.02 | 0.02 |
| Wichita St. | Amer | 0.03 | 0.03 | 78.12 | 78.12 | 0.01 | 0.01 |